Housing Asset Gap Widens to 52-Fold... Top 10% Gain KRW 220 Million, Bottom 10% Stay Flat
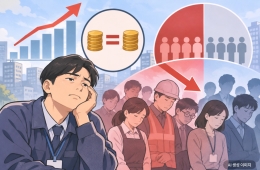
The average housing asset value gap between households in the top 10% and those in the bottom 10% widened to 52-fold. Housing assets held by the top 10% rose by KRW 220 million in a year, while those held by the bottom 10% remained at KRW 30 million. The polarization in housing assets is becoming increasingly pronounced.
According to the 2025 Housing Ownership Statistics released by the Ministry of Data and Statistics on November 16, the average housing asset value of households that owned homes last year was KRW 363 million, up KRW 30 million from KRW 333 million the previous year.

By asset value, the average housing asset value of households in the top 10% (the 10th decile) was KRW 1.56 billion, up KRW 220 million (16.4%) from KRW 1.34 billion the previous year. By contrast, the average for households in the bottom 10% (the first decile) was KRW 30 million, unchanged from the previous year.
As a result, the gap in average housing asset value between the top and bottom 10% widened to 52-fold. The gap grew further in just one year, compared with 44.7-fold in 2024. Households in the top 10% owned an average of 2.2 homes, more than twice the 0.97 homes owned by those in the bottom 10%. Average home size also differed: 110.7 square meters for the top 10%, compared with 62.8 square meters for the bottom 10%.
The number of households that owned homes also increased overall. Of the 22,495,000 general households last year, 12,965,000 owned homes, up 281,000 (2.2%) from the previous year. The homeownership rate, or the share of all general households that owned homes, rose 0.7 percentage points to 57.6%.
A total of 3,374,000 households owned two or more homes, accounting for 26.0% of all homeowning households. This was an increase of 70,000 from 3,304,000 the previous year. The number of households that owned one home rose by 212,000 from the previous year to 9,592,000.
The number of individual homeowners rose by 330,000 (2.1%) from the previous year to 16,306,000. By age group, people in their 50s accounted for the largest share at 25.0%, followed by those in their 60s (23.1%), 40s (19.7%), 70s (13.3%), and 30s (9.1%). The average number of homes owned per homeowner fell to 1.06 from 1.07 the previous year.
A total of 2,421,000 individuals owned two or more homes, accounting for 14.8% of all homeowners. Their share fell by 0.1 percentage points from the previous year. By region, the share of multiple-home owners was highest in Jeju (19.9%), followed by South Chungcheong (17.4%) and Gangwon (17.2%). By age group, the share was highest among people in their 60s (18.1%), followed by those in their 50s (18.0%), 70s (15.0%), and 40s (13.8%).
Hot Picks Today
 "Two Spend 500,000 Won in a Flash, Yet Wait Two Hours?" ... 'Dreamland' Shunned by Kids and Foreign Tourists
- The Era of Getting 200 Million Won After 30 Years Is Over... A Japanese Bank's "Perpetual Department Head" Who Just Clocked In Cries Out
- Spain Hit by Its Worst Tragedy... Lee Kangin, Moreno and Real Madrid Join Soccer World in Mourning
- They Said, “Make It Your Home for Life” - Then Suddenly Kicked 200 Passengers Off... What Happened to the Around-the-World Cruise?
- "130 Rice Bowls Sold Out in a Day"... 'Unfiltered Face' Adds 8 Million Won to Night Market Sales: China's Bungeunwoo
A significant number of people also changed their homeownership status. Of those who owned no home in 2024, 791,000 became homeowners last year. Among them, 17,000 acquired two or more homes. Conversely, 351,000 people went from owning a home to owning none. Compared with 2024, the number of people who owned more homes last year increased by 1.07 million, while the number who owned fewer fell by 590,000.
© The Asia Business Daily. All rights reserved. Unauthorized AI training and use prohibited.