Examining Plastic Surgery and Ophthalmology Fees: "Top 20% Account for 80% of Non-Covered Services"
Kim Yoon Analyzes Non-Covered Service Reliance Among Clinics
Some Facilities Recorded KRW 2.3 Billion in Monthly Non-Covered Fees with Zero Covered Services
"Need to Establish a System to Manage the Appropriateness of Non-Covered Medical Service
It has been found that some clinics are relying on non-covered (uninsured) services for the majority of their total medical revenue. There are even plastic surgery clinics where the monthly medical bills exceed 2.3 billion won, all of which come from non-covered services.

According to an analysis by Assemblyman Kim Yoon of the Democratic Party of Korea, a member of the National Assembly’s Health and Welfare Committee, based on non-covered service reports from March 2025 submitted by the National Health Insurance Service, there were as many as 605 clinics where over 80% of total medical revenue was generated from non-covered services.
This analysis excluded items with little direct relevance to actual medical practice, such as certification fees, as well as dental, Korean medicine, and oriental medicine practices. It targeted a total of 31,596 medical institutions—clinics, hospitals, general hospitals, tertiary (advanced) general hospitals, long-term care hospitals, and psychiatric hospitals. In March 2025, these institutions generated a total of 1.0445 trillion won from non-covered services and 6.9300 trillion won from covered services, making the proportion of non-covered services in total medical revenue 13.1%.
By type of medical institution, hospitals had the highest ratio of non-covered services to total medical revenue at 25.0%, followed by clinics at 18.6%. However, in terms of absolute volume, clinics accounted for the largest share, totaling 490.3 billion won, or 46.9% of all non-covered medical revenue across institutions.
There were also significant differences by institution. Among all institutions analyzed, 1,825 had a ratio of non-covered medical revenue exceeding 50%. Of these, 622 relied on non-covered services for at least 80% of their total revenue. For clinics specifically, 1,598 had a non-covered services ratio over 50%, and in 605 of these, more than 80% of total medical revenue came from non-covered services. In contrast, all 47 tertiary general hospitals included in the analysis had a non-covered services ratio below 10%.
Within clinics, non-covered medical revenue was concentrated in relatively few institutions. Dividing 28,770 clinics by non-covered billing volume, the top 1% (288 clinics) accounted for 126.5 billion won, or 25.8% of total non-covered clinic revenue. The top 5% of clinics generated 50.0% of all non-covered clinic revenue. The concentration increased to 65.2% when considering the top 10%, and reached 80.5% for the top 20%. By contrast, the bottom 30%—8,631 clinics—generated just 6.3 billion won in non-covered revenue, only 1.3% of the total.
The clinics with the highest amounts of non-covered medical revenue included institutions presumed to be health screening centers, as well as plastic surgery and ophthalmology clinics. At Institution A, located in Gyeonggi Province, non-covered medical revenue reached 4.3 billion won in March 2025—the highest among all clinics—and 92.2% of its total revenue came from non-covered services. For institutions classified as “Other (Center)” (institutions A through G), monthly non-covered revenue was between 2.6 billion and 4.3 billion won, with non-covered services comprising nearly 90% of all revenue at most of them.
At H Plastic Surgery Clinic in Seoul, the non-covered medical revenue reported in March last year was 2.34 billion won, and the clinic’s entire medical revenue came from non-covered services. When simply annualized, this equates to at least 28 billion won in annual non-covered revenue. Kim’s office explained that actual figures may be even higher, as not all non-covered items are included in the reporting data.
Dependence on non-covered services also differed by medical specialty. Among clinics, plastic surgery had the highest average ratio of non-covered revenue at 51.8%, followed by thoracic surgery at 33.0%, rehabilitation medicine at 31.2%, “Other (Center)” at 26.9%, radiology at 24.9%, orthopedics at 23.4%, neurosurgery at 22.5%, anesthesiology and pain medicine at 21.7%, and dermatology at 20.2%. Pediatrics and obstetrics & gynecology had relatively low rates, at 11.3% and 9.4% respectively.
Hot Picks Today
 "Two Spend 500,000 Won in a Flash, Yet Wait Two Hours?" ... 'Dreamland' Shunned by Kids and Foreign Tourists
- The Era of Getting 200 Million Won After 30 Years Is Over... A Japanese Bank's "Perpetual Department Head" Who Just Clocked In Cries Out
- Spain Hit by Its Worst Tragedy... Lee Kangin, Moreno and Real Madrid Join Soccer World in Mourning
- They Said, “Make It Your Home for Life” - Then Suddenly Kicked 200 Passengers Off... What Happened to the Around-the-World Cruise?
- "130 Rice Bowls Sold Out in a Day"... 'Unfiltered Face' Adds 8 Million Won to Night Market Sales: China's Bungeunwoo

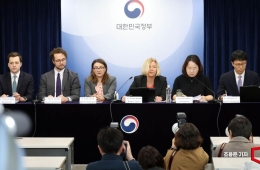
Assemblyman Kim stated, "The fact that some clinics rely on non-covered services for the majority of their medical revenue suggests that there is a structure centered on non-covered treatments within the outpatient sector. There is a need to strengthen systems to assess and manage the medical necessity and appropriateness of non-covered services."
© The Asia Business Daily. All rights reserved. Unauthorized AI training and use prohibited.