Even When the Fed Raised Rates, the S&P Didn't Always Fall
Even with Rate Hikes, Solid Economy Leads to Over 90% Market Gains
KOSPI Shows Little Correlation with U.S. Rates
"KOSPI is Establishing a W-Shaped Bottom"
As the likelihood of a U.S. Federal Reserve (Fed) interest rate hike increases, concerns are mounting in the Korean stock market. However, analysts in the securities industry point out that the underlying reasons and pace behind the rate hike are more important than the mere act of raising rates itself.

According to Shin Young Securities on September 16, out of the 26 tightening cycles of U.S. base rates since 1971, the S&P 500 index rose 17 times. Specifically, during periods of robust economic growth (13 times), the S&P 500 rose by an average of 10.7%, with the index climbing 12 out of 13 times. In contrast, during inflation-fighting rate hike cycles (13 times), the index declined by an average of 1.1%, increasing only on 5 occasions. In “inflation-fighting” cycles, the Fed raises rates abruptly to curb late, runaway inflation, which denies corporations and markets ample adaptation time and delivers a shock. In contrast, “economic resilience” hikes allow the market to absorb higher rates fueled by solid demand.
Korea’s stock market direction has not been determined solely by the extent of U.S. rate hikes. During six Fed tightening cycles since 1990, the KOSPI saw starkly divergent outcomes—for example, a -51.1% return in 1994 compared to a 60.7% gain in 2004. Notably, between 2004 and 2006, despite the Fed raising rates by 425 basis points (1bp = 0.01%), the KOSPI surged over 60% on the back of booming exports to China and steady inflows into systematic investment funds.
On the other hand, 2022 was a textbook inflation-fighting tightening phase, dealing a major blow to markets. That year, in response to the highest inflation in 40 years, the Fed hiked rates rapidly by a total of 425 basis points across seven moves, including four consecutive 75bp hikes. During this period, the KOSPI underwent a sharp correction as soaring exchange rates and turbulence in the funding markets overlapped. Subsequently, in 2023, expectations for inflation moderation and an end to rate hikes, combined with the tailwinds from semiconductor production cuts and artificial intelligence (AI), fueled a rebound. As a result, the cumulative KOSPI return over the entire 525bp rate hike phase closed at -2.5%.
Shin Young Securities emphasized that the key issue to monitor in the current environment is not simply whether the likelihood of further rate hikes is diminishing, but whether delayed inflation control could necessitate even stronger tightening measures in the future. The firm highlighted the need to evaluate monetary tightening based primarily on the inflation situation, while also assessing the real ability to shoulder higher rates through consumption and employment data. If the rate increase is underpinned by a robust economy, it does not necessarily signal an immediate warning for investors to exit the stock market.

From a technical analysis perspective, there are signs that the market is entering the stage of forming a second bottom after a sharp decline. According to KB Securities, historically, after the KOSPI suffers a drop of more than 25%, the process of bottom formation has taken three main forms: V-shaped, W-shaped, and triple bottom. The W-shaped rebound—by far the most common—appeared after most major market plunges, such as in 1997, 2004, 2018, and 2022–2023. This is because it takes time for the market to fully resolve uncertainties, with the period between the two lows usually spanning one to three months.
By contrast, the rare V-shaped rebound has only occurred amid extremely powerful and extraordinary policy stimuli—such as massive quantitative easing or large-scale subsidies—during events like the Iraq War in 2003 or the COVID-19 pandemic in 2020. The triple bottom pattern, appearing just three times, manifested during the 1998 Asian financial crisis, the 2001 dot-com bubble burst, and the 2008 global financial crisis, all characterized by stock prices being cut in half or more.

Beyond patterns of bottom formation, it is also crucial to watch how strong markets reach their peak after rebounding. In large bull runs that soared at rates similar to the current AI-driven rally—such as the “three lows” boom (1986–1989) and the dot-com bubble (1998–1999)—all concluded with a “double top” formation. After a drop-off, indices rebounded powerfully near previous peaks, driven by factors like earnings improvement or expectations of rate cuts. However, once the “fear of missing out” (FOMO) peaked at the second summit, the rally came to an end.
KB Securities researcher Lee Euntaek said, “Currently, the market is in the process of forming a W-shaped bottom. Investors who endured the first bottom often feel a stronger urge to sell at the second.” He added, “The common factor that triggered the collapse of the two historic bull markets was precisely the fear of a trend of tightening by the Fed. Future interest rate uptrends, like the gravity of a black hole, can pull down the price of every asset—recognizing this risk in advance is essential.”
Hot Picks Today
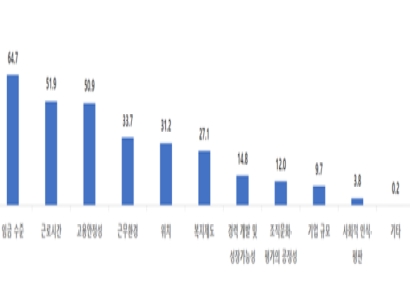 "Please Pay Me at Least 3 Million Won a Month": More Than Half of Young People Today Prioritize "Working Conditions" Over Company Size
- Selling Like Crazy Every Year... 30-Year-Old Hetbahn Takes on a New Challenge: Tastes Better Than "Mom's Home Cooking" [On-Site Report]
- He Left It in the Car and Forgot... "I Nearly Collapsed with Joy": Man Wins $1.48 Million Lottery
- Ran 18 km With 9-Year-Old Tied to Him at the Waist... "Man Banned From Competing for 3 Years"
- Beachgoer Finds 'Plastic' That Turns Out to Be Perfume Ingredient Worth More Than Twice as Much as Gold

© The Asia Business Daily. All rights reserved. Unauthorized AI training and use prohibited.